Observer is my current side project. The end-goal of the program is to continuously monitor global events and provide a platform for analysis, prediction, and reaction.
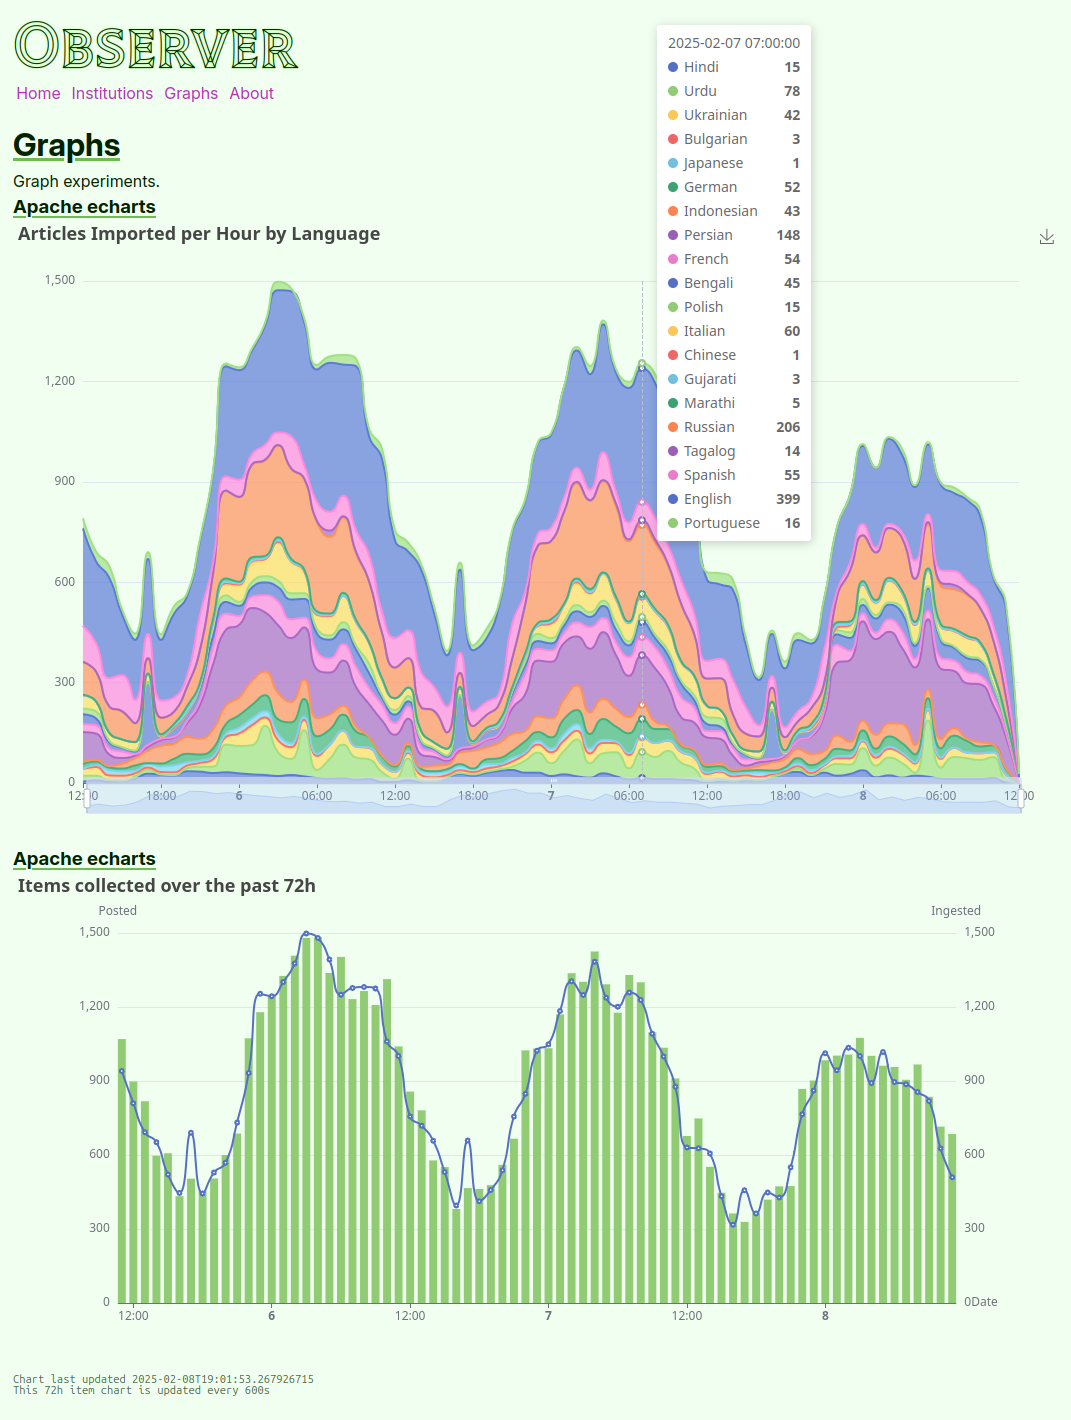
You can check out part of the frontend at observer.ryanfleck.ca
If you stick on the page for a minute, you’ll notice that many elements are pulled from the server automatically - notably the ’latest items’ feed below the graph of incoming news items.
The personal problem I am attempting to solve with Observer:
- I don’t know what is going on globally.
- Panic-inducing headlines flash by.
- It is difficult to correctly weigh a headline.
- Modern journalists are obviously puppeted and untrustworthy.1
- Coordinated propaganda emerges in ways that are difficult to detect.
By automating the construction of a semantic graph2 fed by the flow of media chatter, I will be better able to assess both the relations between outlets and the relations between outlets and emergent concepts. Graphs like these, without weights, are traditionally represented with RDF structures.
RDF is based on the idea of subject-predicate-object triples, also known as RDF triples. An RDF triple consists of a subject, a predicate, and an object. The subject is a resource that is being described, the predicate is a property or relationship of the resource, and the object is the value of that property or relationship. – graph.build
Along with the weights, I am hoping to produce an automated method to assess the leanings and integrity of each institution based on the content they produce. All good dreams to be addressed in due time.
Here’s what some of the Observer UI looks like today:
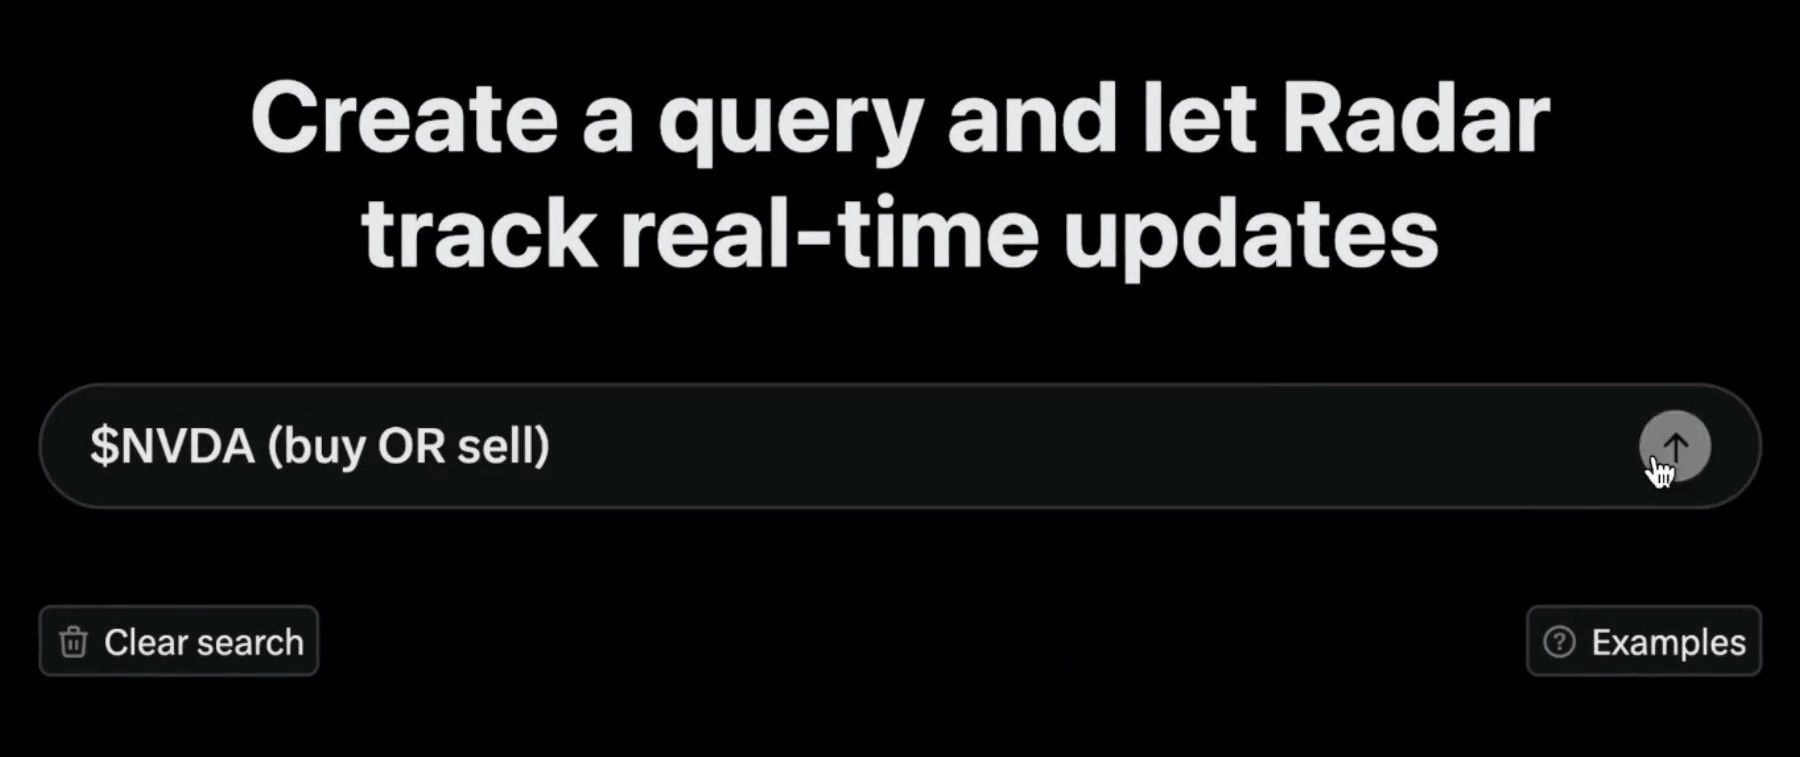
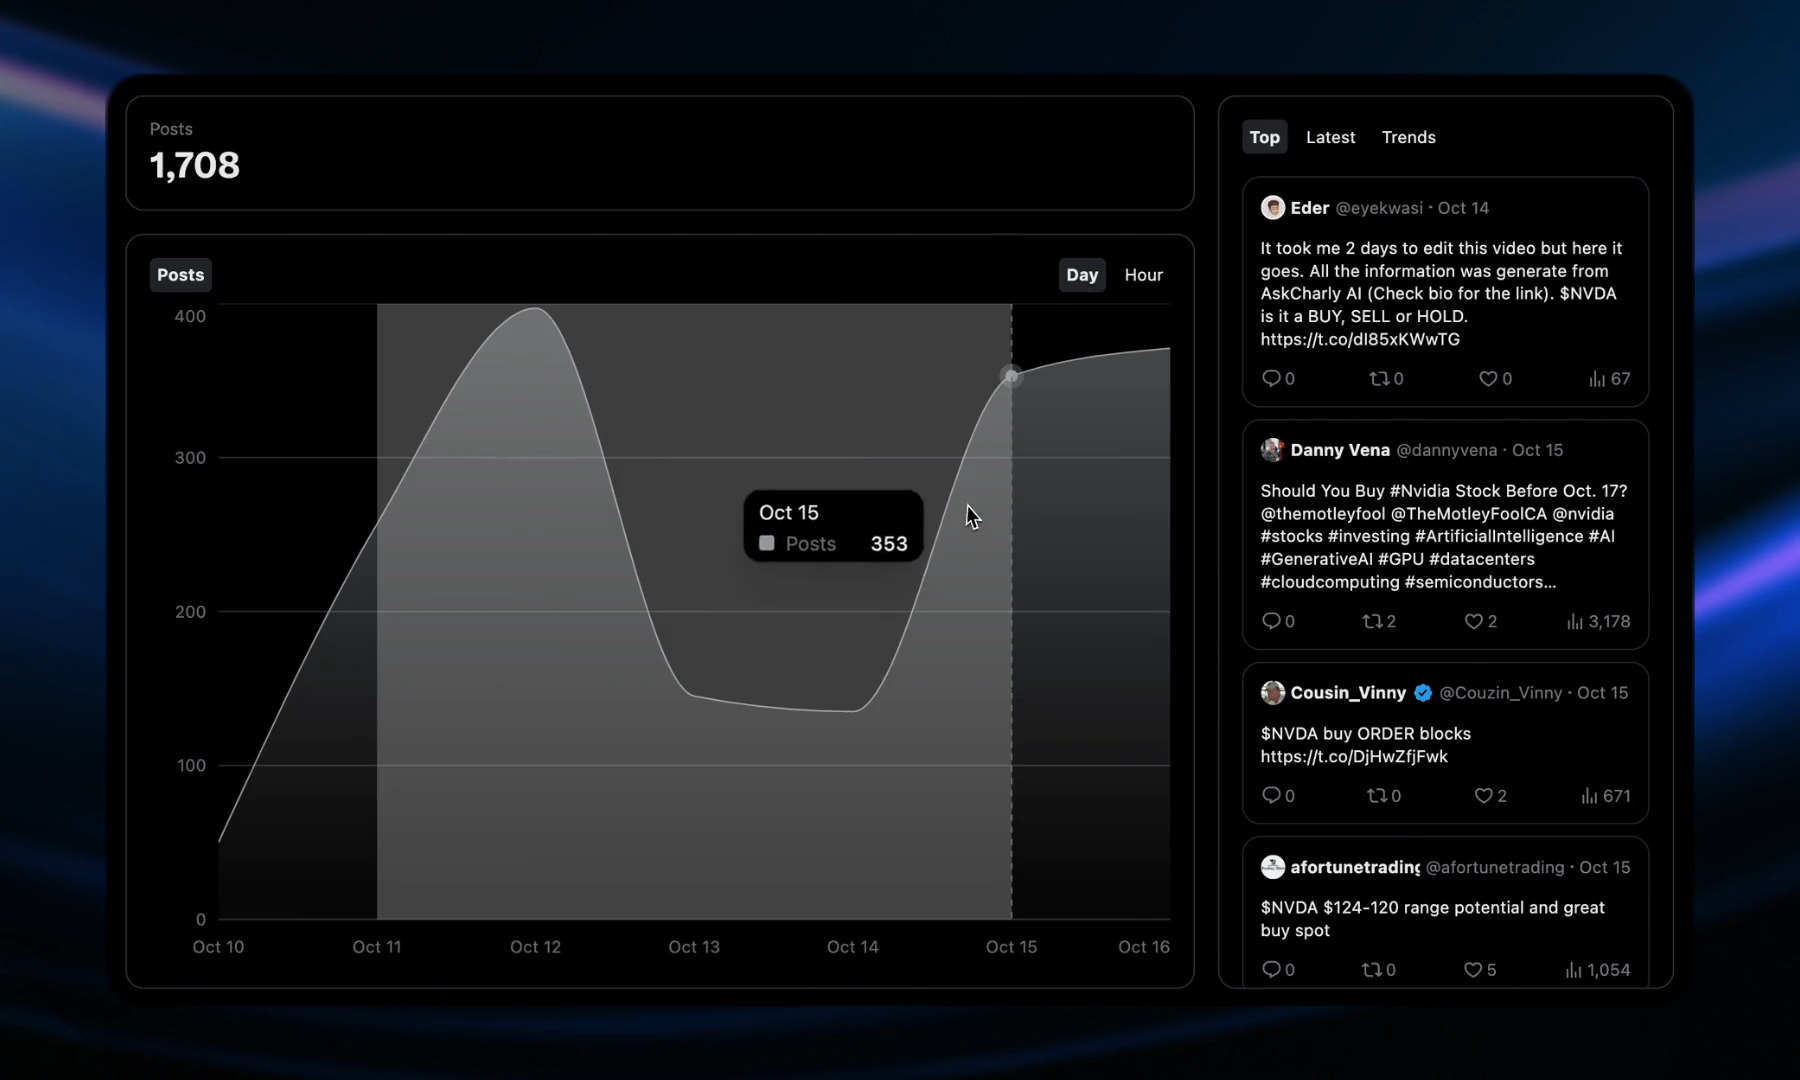
It’s funny that X has released a feature that I had percolating which they have aptly named Radar - providing paying users with the ability to observe custom topics over time. I don’t have a huge crew of the best software engineers on hand to speed up my side project, but if I did, I’d be upset that Elon beat me to the punch!
Certainly, the features I want to focus on next are primarily related to building, searching, and visualizing the ever-evolving web of relations between institutions, media items, topics, and narratives.
What technologies are being used to develop this solution?
Underpinning all this is the Clojure programming language, a stable foundation for long-term projects like this. I’ve learned a ton about deploying Clojure apps (and, by extension, JVM services) along the way, keeping in mind performance, fault tolerance, logging, and error reporting, etc.
While the solution is poised to scale and deploy, it is difficult to justify any excess cost with no customers - so it is simply deployed in my laundry room for now.
As the tables grow, I figure I’ll need to make a decision on how much historical data I want to keep. As long as the graph is maintained, the media data can be fairly transient - though in a perfect world I’d keep it forever.
Currently the database with just headlines occupies 2.9G on disk for 2,363,773 items dating back a couple months including indexes. Some tables are, obviously, hidden. As I haven’t learned Timescale3 yet, many of the date columns are indexed to enhance retrieval speed.
du -sh observer-media-data/
 --> 2.9G
observer_prod=> select count(*) from media.items;

  count
---------
 2363773
observer_prod=> \dt+ media.*

             Name             |    Size
------------------------------+------------
 institutions                 | 120 kB
 items                        | 1709 MB     (1.7 GB)
 sources                      | 216 kB
observer_prod=> \di+ media.*

                   Name                   |            Table             |    Size
------------------------------------------+------------------------------+------------
 idx_institution_urlkey                   | institutions                 | 32 kB
 idx_media_item_created                   | items                        | 51 MB
 idx_media_item_posted                    | items                        | 51 MB
 idx_media_item_source                    | items                        | 25 MB
 idx_media_item_uri                       | items                        | 169 MB
 idx_media_item_uri_institution_unique    | items                        | 172 MB
 idx_media_item_uri_source_unique         | items                        | 198 MB
 idx_media_source_url                     | sources                      | 48 kB
 idx_media_text_analysis_v1_item          | text_analysis_v1             | 8192 bytes
 idx_through_keywords_to_text_analysis_v1 | keywords_to_text_analysis_v1 | 8192 bytes
 items_pkey                               | items                        | 72 MB
 text_analysis_v1_pkey                    | text_analysis_v1             | 8192 bytes
All said - very fun project so far.
…
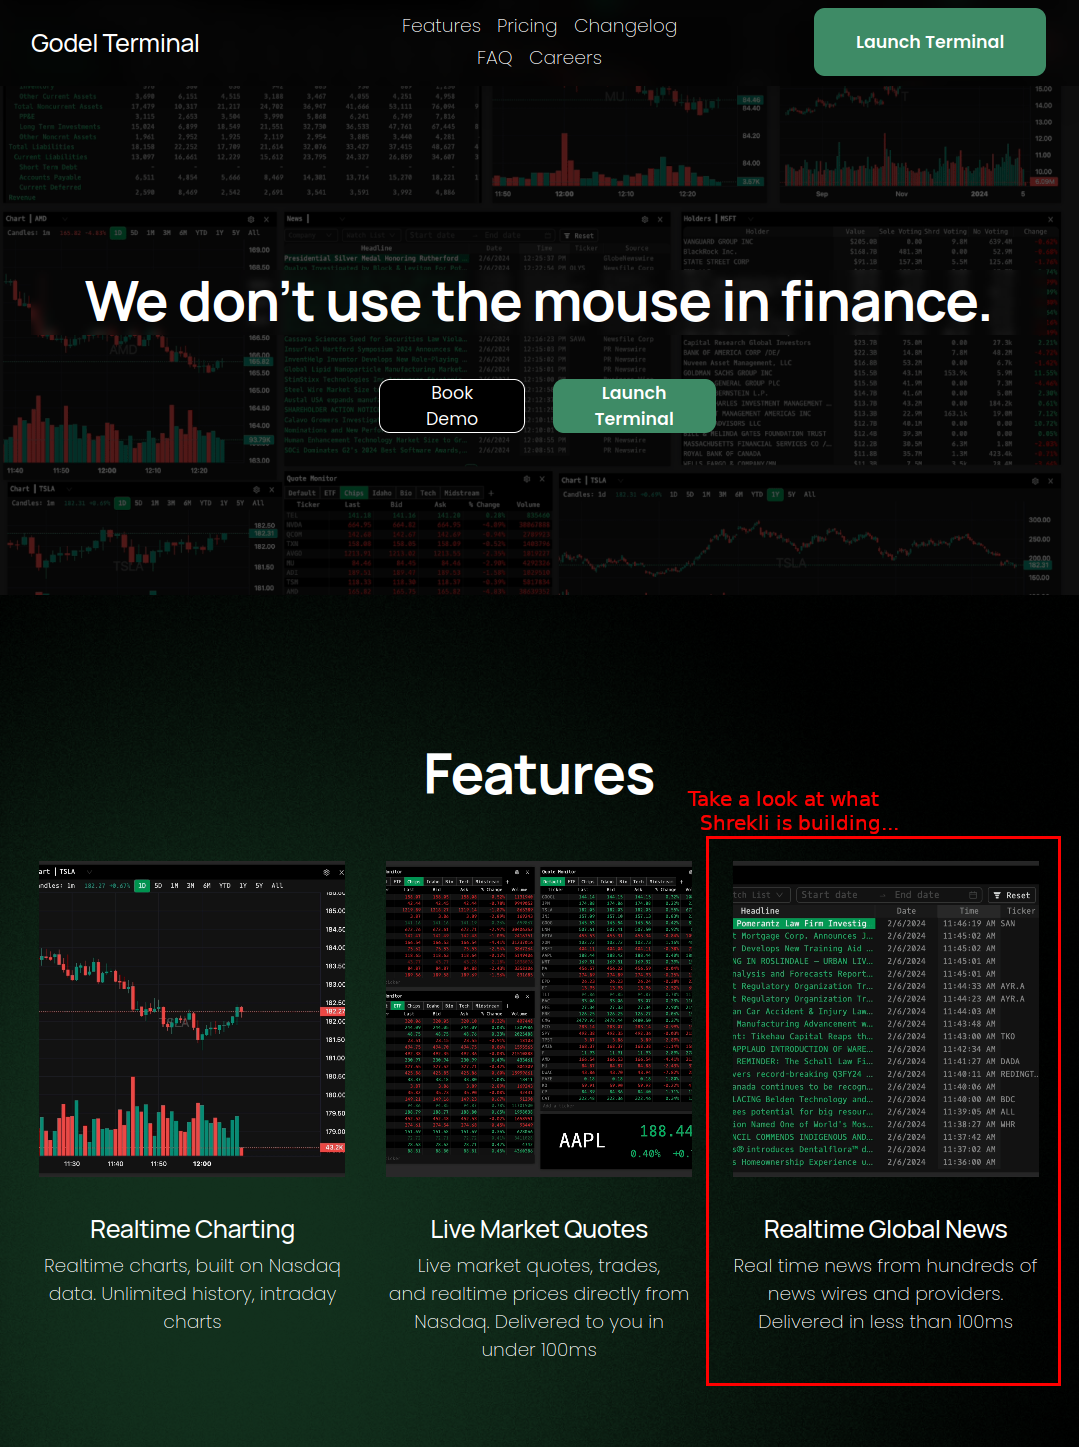
I am not the only one building systems like this - and systems like this are not novel. Traders in particular have always had an interest at running algorithm-driven systems to feed their reflexive high-frequency trading systems.
The careers page for Godel Terminal lists a familiar set of technologies. It feels good knowing that those at the bleeding edge have made similar technology choices.
Godel Backend Stack:
- Backend: JVM, Kotlin, Python, Spring Boot, Kafka, Kubernetes
- Monitoring/Visualization: Grafana, Prometheus
- Database: PostgreSQL, Clickhouse
- Cloud Infrastructure: AWS, Terraform
Maybe I should apply?
“Semantic Graphs” graph.build ↩︎
“Timescale is Postgres made powerful” timescale.com ↩︎